1. Tero finds issues
Tero starts with issues: cost waste, compliance exposure, signal-quality problems, and checks that found policy opportunities. The Issues workspace shows each finding with priority, category, affected service, status, and the next review step.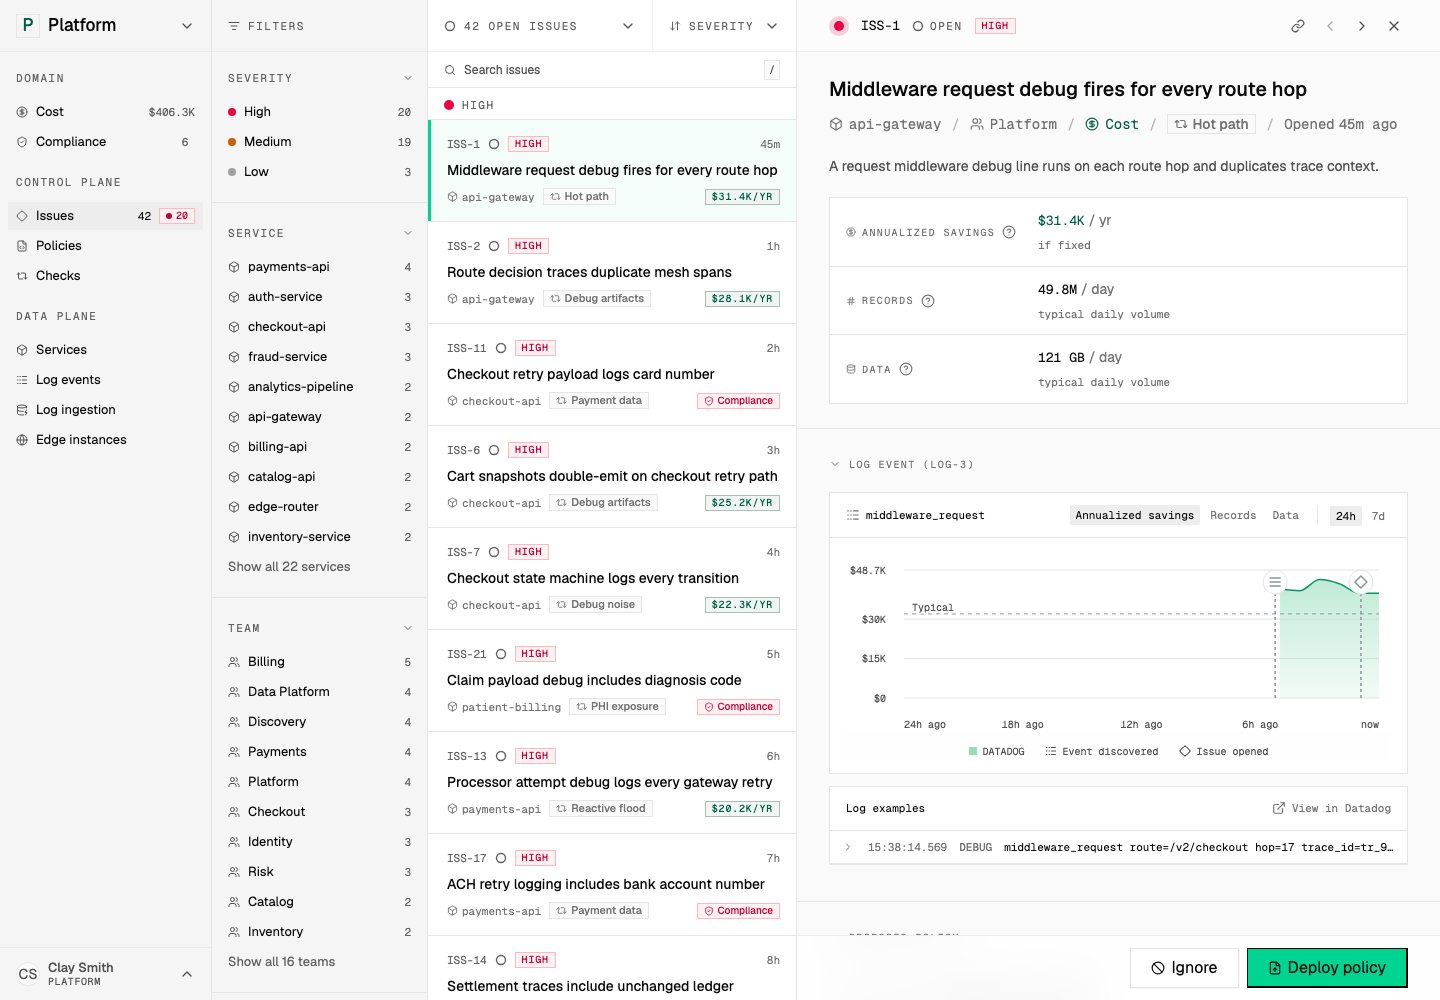
Issues show the work queue for telemetry control. Open in demo
Cost and Compliance lanes give you another view of the same work. They group affected services and link back to the issues that explain the problem.2. Evidence supports the recommendation
Issue detail explains the finding, its cost or compliance stakes, and the supporting evidence. Evidence can include representative log events, field analysis, related checks, affected services, volume, cost, or compliance exposure. Tero also shows provenance. A reviewer can see whether a recommendation came from a check, catalog context, provider inventory, or runtime state. This keeps review grounded in facts from systems you operate.
The recommended policy card connects evidence to a concrete action. Open in demo
3. A policy captures the change
Tero presents a recommended policy for issues a policy can address. The policy states what telemetry it matches and what action it takes, such as dropping, sampling, redacting, or transforming matching log events. Approved policies appear in the Policies workspace. Policy detail shows identity, source, related issue, activity, spec, and deployments. The spec is reviewable because the policy is the control-plane artifact that other systems execute.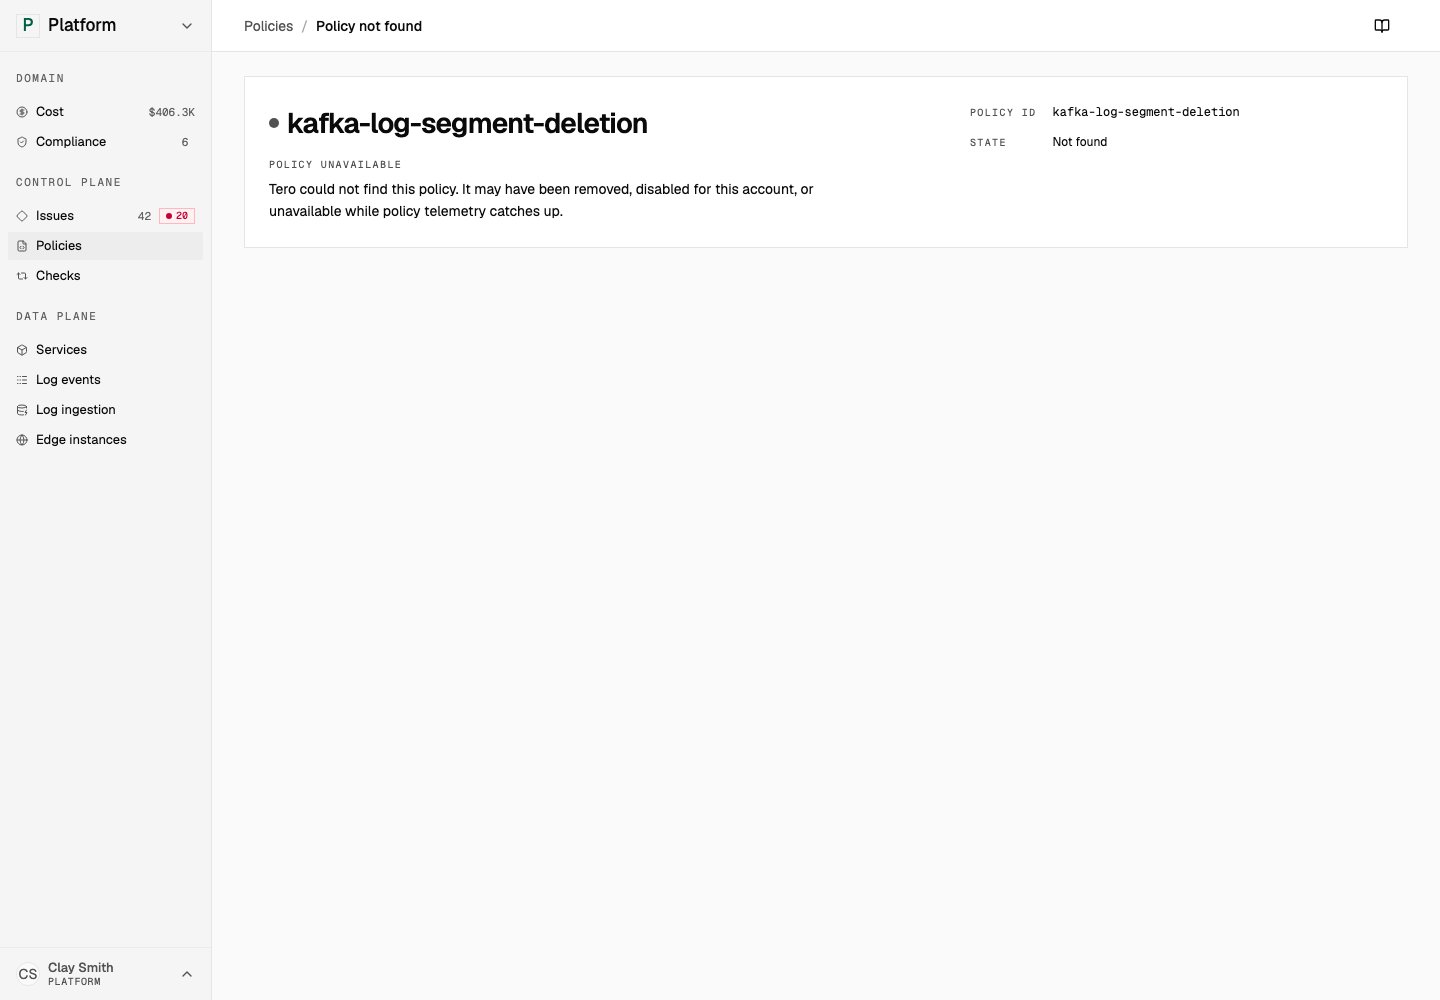
Policy detail shows the reviewed change, its source issue, spec, activity, and deployment state. Open in demo
4. Runtime surfaces show where policies run
Policies can run through provider configuration, repositories, collectors, or Tero Edge. The Edge instances screen shows the runtime side of the loop: live instances, deployed policy counts, policy errors, last-seen state, and correlated issues.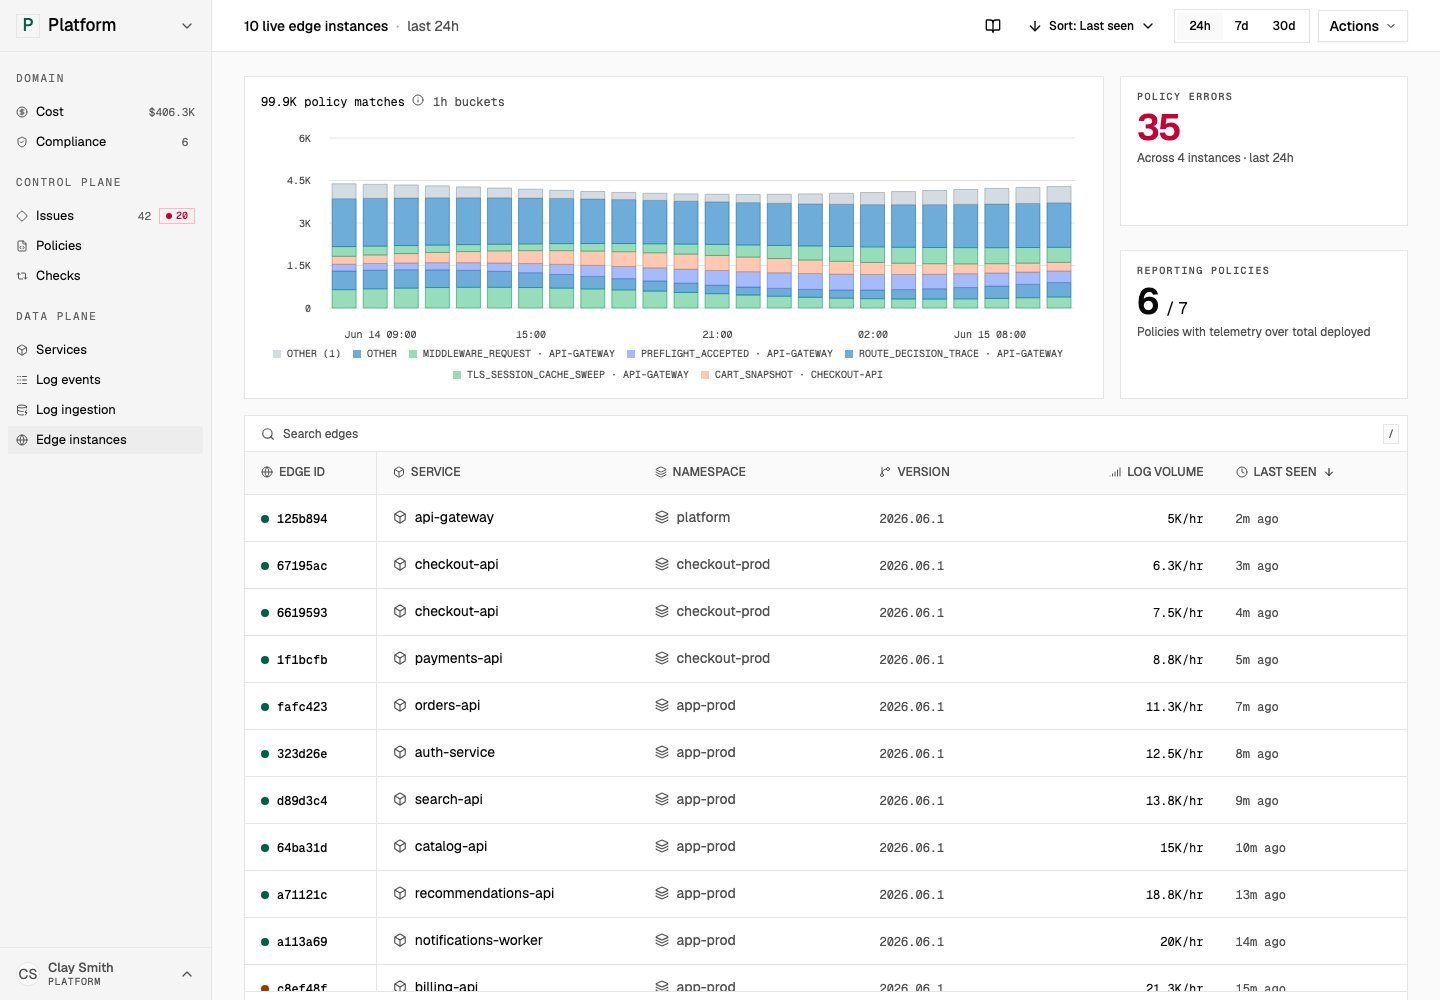
Edge instances show runtime policy state. Open in demo
Tero shows state and review controls. Providers, Git repositories, collectors, and Edge instances perform the production changes.5. Impact closes the loop
After action, Tero tracks impact: issue status, cost movement, compliance exposure, policy activity, and runtime deployment state. If a policy stops matching, fails to deploy, or leaves a related issue open, Tero keeps that visible and keeps the issue, its policy, the runtime state, and the impact connected.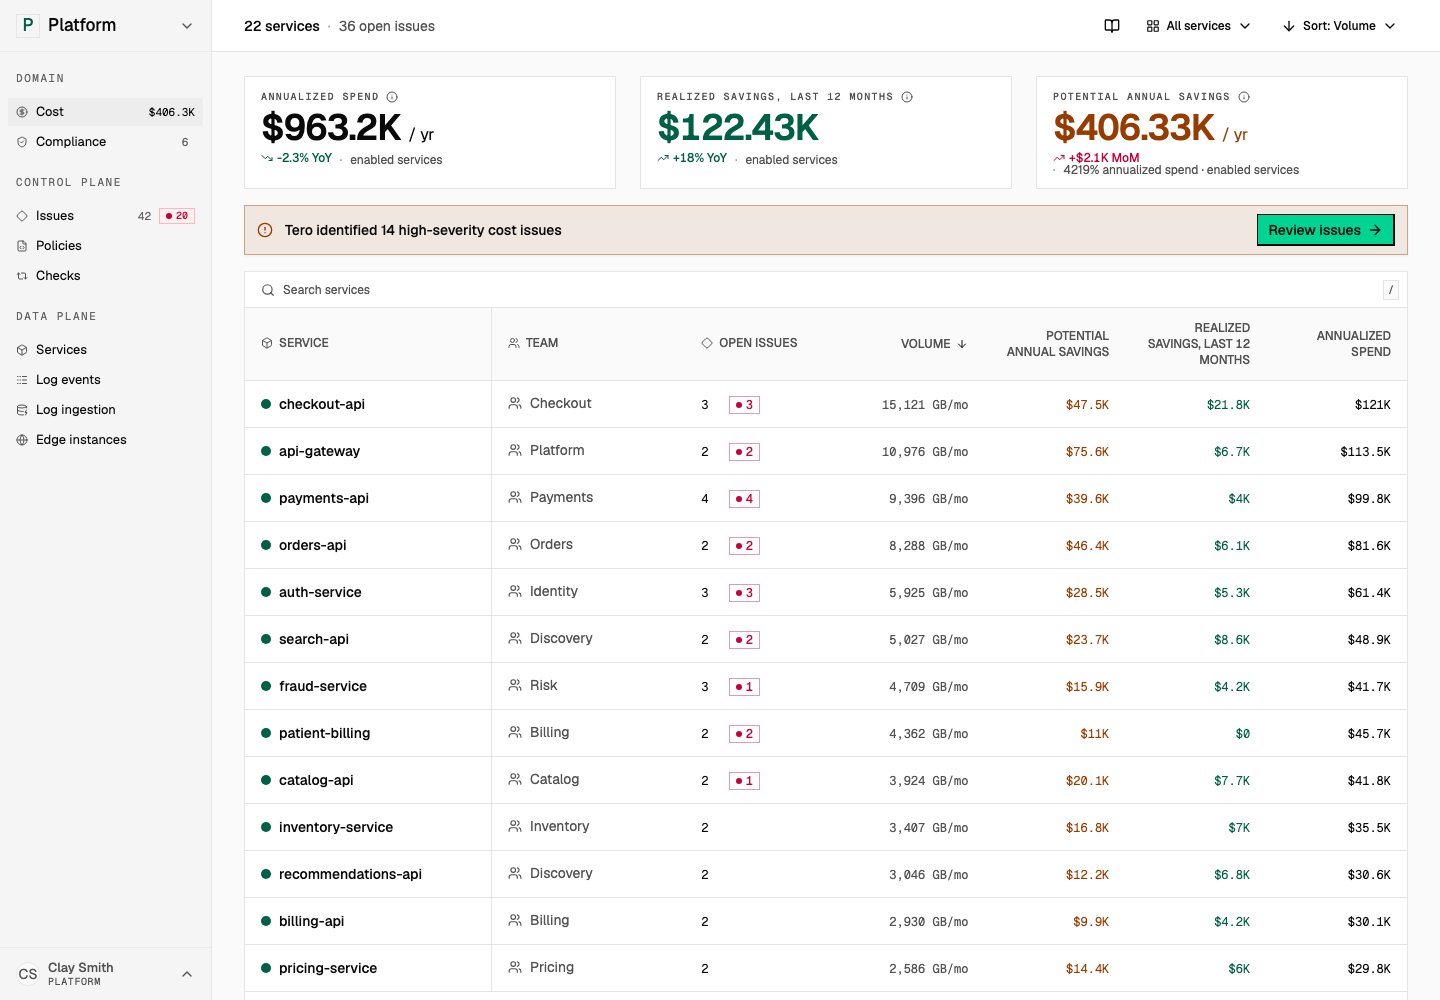
Cost shows whether telemetry policy work changed spend and recoverable savings. Open in demo